Model type
Detector
Maximum area / minimum area
Max – 1000 sq. km.
Min – 2 sq. km.
Average time of request execution
About 30 minutes
Price
50 $ per 1 sq. km.
Overview
Model description
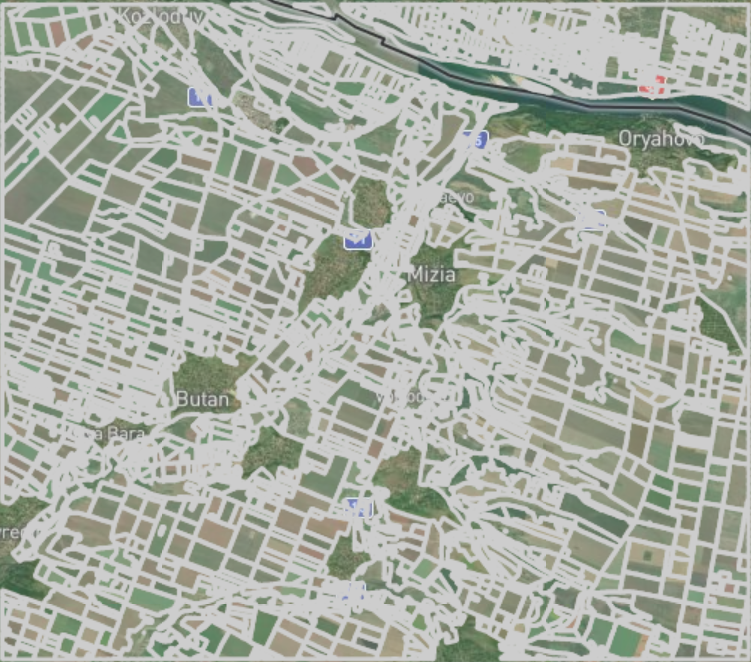
Model detects boundaries of agricultural fields during the growing season. It can be used to easily detect fields for detailed analysis and the changing boundaries, year to year.
Selecting the date
To run the model, users can choose one of two seasons – winter and summer.
The summer season starts on June 1 and ends on August 31.
The winter season starts on November 1 and ends on March 1.
Output
The GeoJSON with detected plot boundaries polygons.
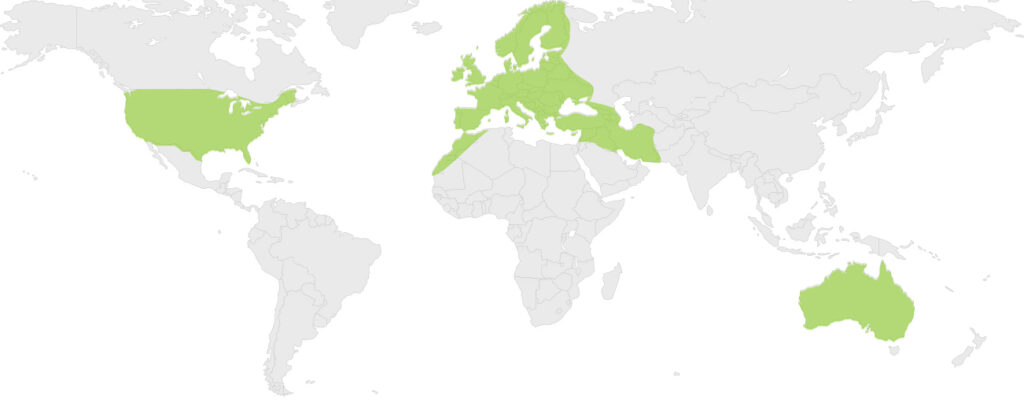
Available geographical region
Technical information
Technical description
The model uses Semantic segmentation neural networks to detect the plot boundaries. To get the best possible quality We apply the model on 5 available images during the growing season. Such a technique removes field work effects, like for example images in the middle of harvesting, when plot might be splitted by 2.
The model uses all available images during the growing season to ensure the best possible forecast quality. This is usually 10 to 30 satellite images from Sentinel 2.
Spatial resolution
Spatial resolution: 10m per pixel
Input data sources
Optical: Sentinel-2
Accuracy
Thematic accuracy: variable, ~87%